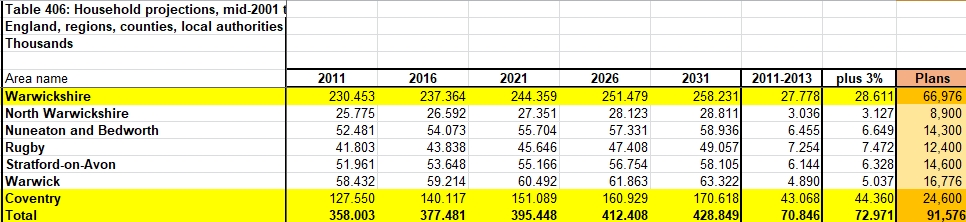
The Office for National Statistics (ONS) have taken over producing household projections from Ministry for Housing, Communities and Local Government (MHCLG). On 20th September 2018 the released projection based on 2016 data showing a need for 25% less housing in England than last projection. For Nuneaton and Bedworth we will have around 6,455 households over 20 years from 2011. The local plans have the crazy idea that we need to build a few more homes to keep the percentage empty constant at around 3%.
It is not all good news as projections for Coventry are still crazy due to mis-forcasting the student growth for another 15 years. However, even ignoring that, for the whole region we are still planning for around 20,000 extra empty homes. 91,000 extra homes for 71,000 extra households.
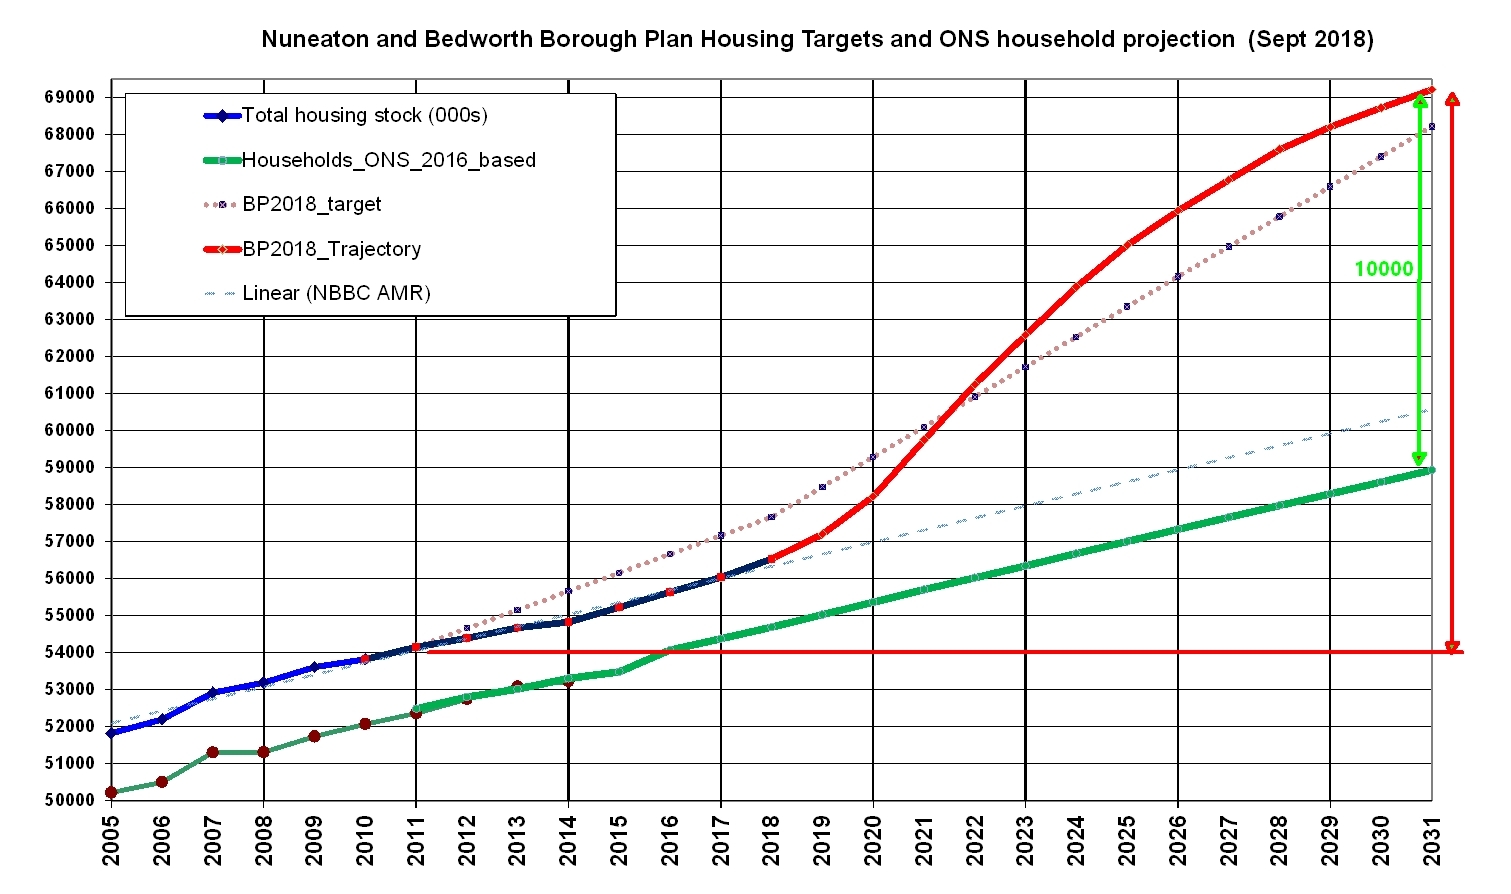
This contains graphs of the Borough Plan housing targets and allocations as they get ever more crazy compared to the forecast number of households in the borough.
Building over 15,000 extra homes for 6,455 households is crazy. Expecting 20,000 extra people to move to Nuneaton and Bedworth is not going to happen.
The planning inspector has sent Nuneaton and Bedworth Borough council a letter, after the stage one hearing about the Borough plan. This note is focusing specifically with the Duty to Cooperate and some of the housing figures issues, and is not meant to be his findings for all of Stage 1
However, it is not that simple. On ‘Duty to Co-operate’ the council has been given the provisional OK. The inspector wrote “Overall, therefore, the evidence before me indicates that the legal duty to cooperate has been met.” but also said “I am not inviting responses from the Council or any other party on my initial judgement on the legal aspect of the Duty to Cooperate“. Given the council has accepted allocating numbers to buy off the objections from some other councils this is not surprising.
Housing Requirement and Supply Capacity
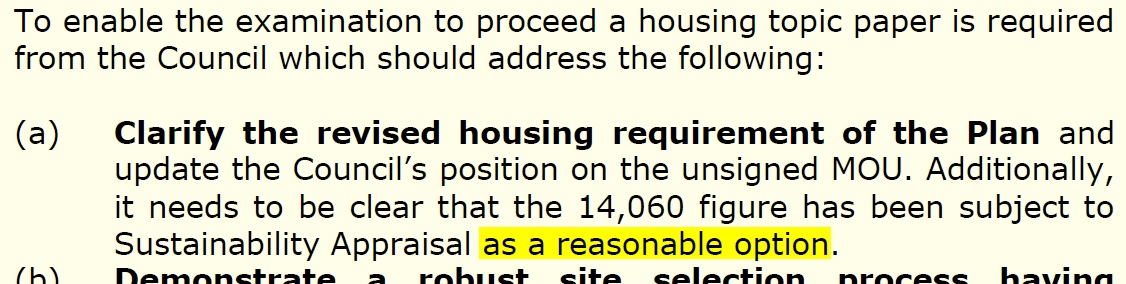
More interesting is what the inspector has written about the so called “robust” calculation of housing numbers. What the inspector has written is “Supply capacity has clearly been the key factor as to whether or not Nuneaton and Bedworth can meet its proposed share of the full housing need of the wider HMA over the period to 2011-2031. It remains for the Council to demonstrate, as a starting point, that there is a justified and effective housing land supply to meet the need for 14,060 dwellings in the Borough as set out in the Memorandum of Understanding, including the element of unmet need within the HMA.” The council is also being asked to provide more evidence that the target is reasonable
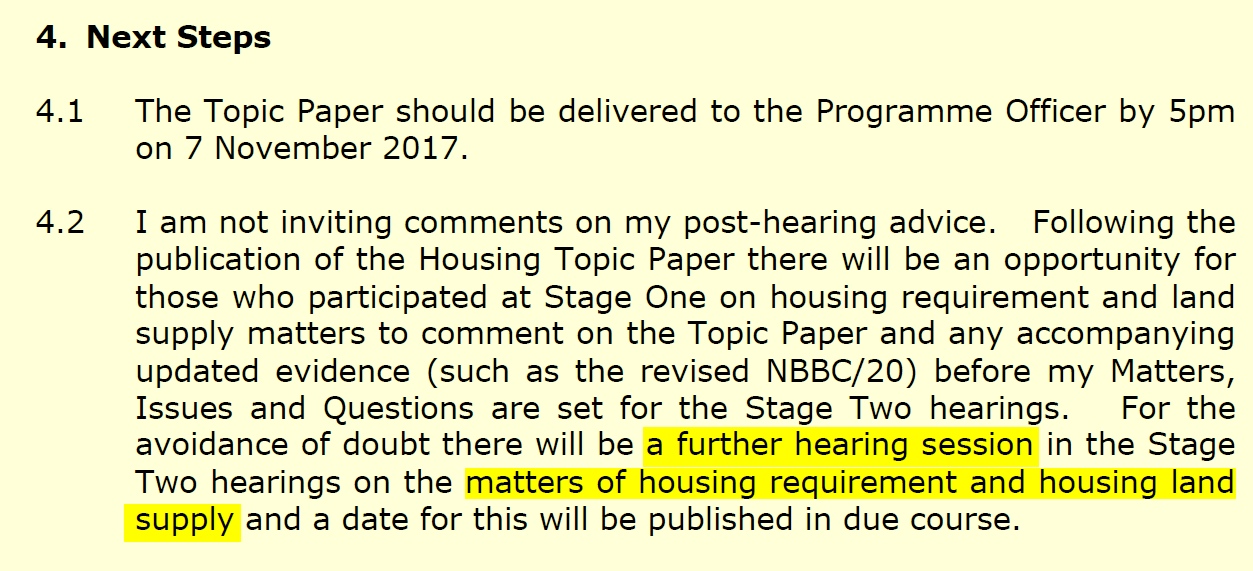
It is also clear that when/if the hearings restart that the discussion on housing numbers is going to be ongoing and important.
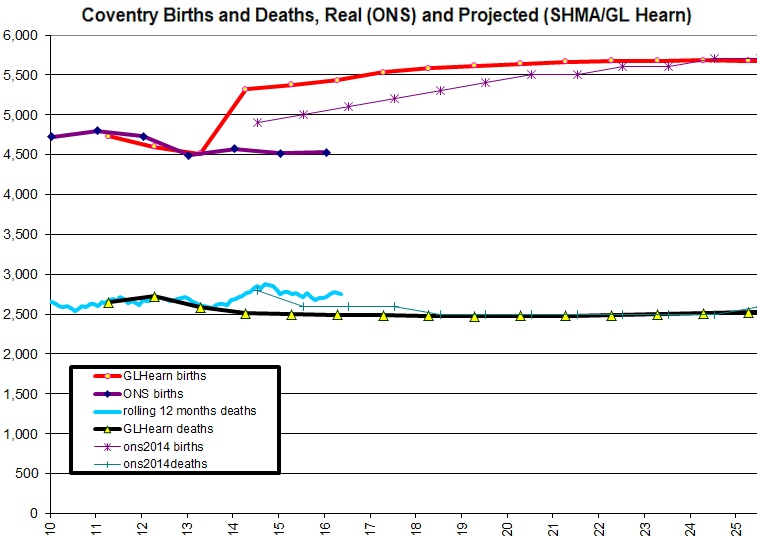
It is shocking that almost everyone in Coventry and Warwickshire is believing the story of massive population growth in Coventry. It is a bit like the emperor’s new clothes. While it is clear that the population is growing and changing, there does not seem to be evidence that new populations are growing exponentially. There is a clear lack of extra new births in the city which were expected. What is more the latest School applications data shows that the number of of children in reception year is falling sharply. The city council has put so much effort into selling the growth story that nothing is coming out about the decline in traditional families.
Falling births & falling school intakes
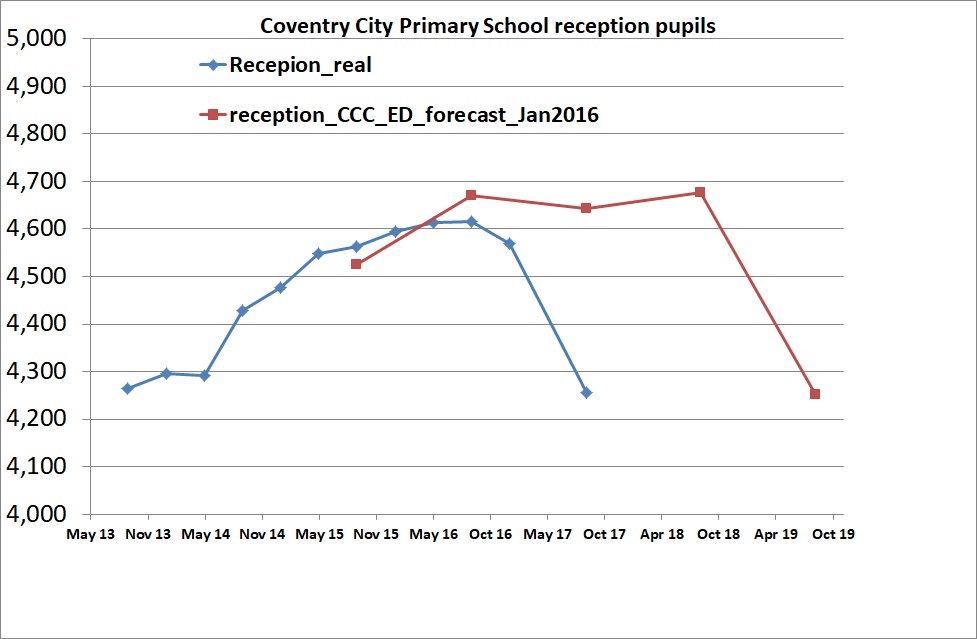
A report to the city council scrutiny panel in January 2016 {1} showed that the council education department was already expecting the admission to reception classes to drop in 2019. The latest school allocation document {2} implies that some 400 expected reception year pupils have vanished in just 1 year.
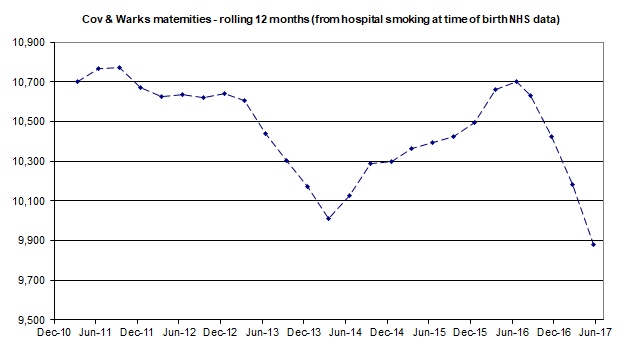
The latest data for births is the maternity rate for Coventry & Warwickshire released as part of monitoring smoking of mothers {4}. This is slightly lower that number of births due to twins etc but is good to see the trend. The data does not take account of where the mother lives and will be impacted by some cross boarder births.
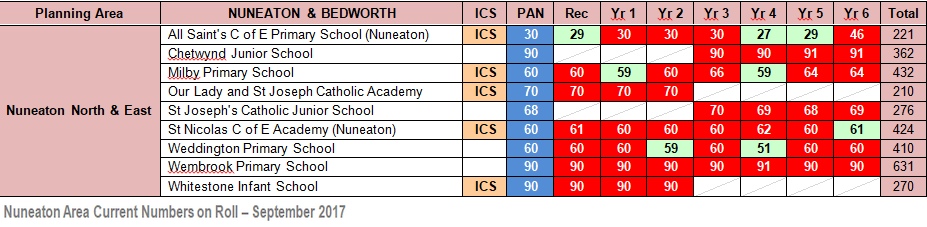
Not only has the birth rate dropped but families are moving from Coventry to Warwickshire putting pressure on Primary schools in areas like the North & East of Nuneaton. This year almost every class in every primary school here is full.
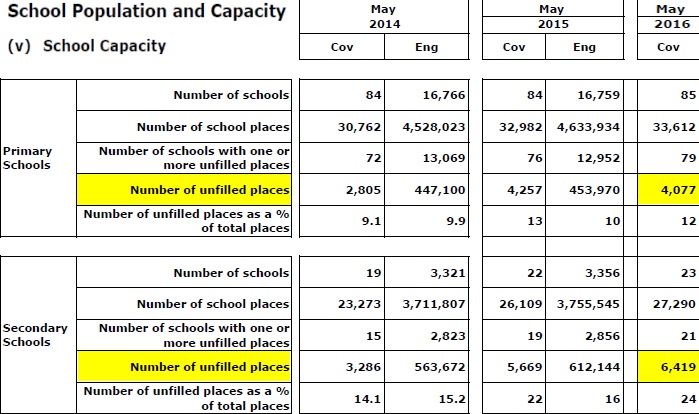
10,000 unused school places
But Coventry seems to have around 10,000 unused school places including about 670 unused in reception year {2}. In recent years primary school capacity seems to have been increased for a permanent rise in birth rates that has ended up as just as bump. Below is from the city council published key statistics.
Many of the cities secondary places will be used as the peak in birth rate works though the system. Capacity has been taken out with the merging of two schools but more may be needed done if the flow of families to Warwickshire continues.
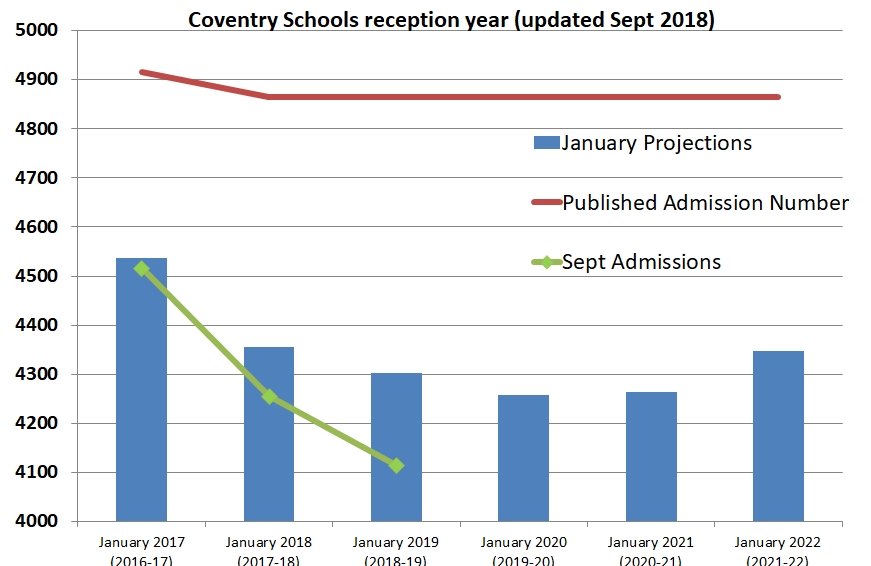
Heading for 29 unused reception classes
Coventry city council latest forecast intake at reception shows a declining trend and real admissions data shows even less children were expected to start in September 2017. It also seems unlikely that intake will increase from 2021 as birth rates are still falling and even less under one year olds are on the October 2017 GP registers. There may be less than 4,000 children for the available 4865 reception school places in 2021.
(update just 4,155 reception year children were accepted for September 2018 with around 850 places unallocated)
Conclusion
We urgently need an honest reassessment of the population size and demographics in Coventry. We are looking at the birth rate being around 20% less than expected in the local plan. There is likely to be a serious error also in the 20-40 year old population which was expected to give rise to over 5,400 births this year. From teh data that has been published in 2017 it looks like in 2017 Coventry mothers will have around 4,300 births.
{1} Education and Children’s Services Scrutiny Board (2) – 7th January 2016
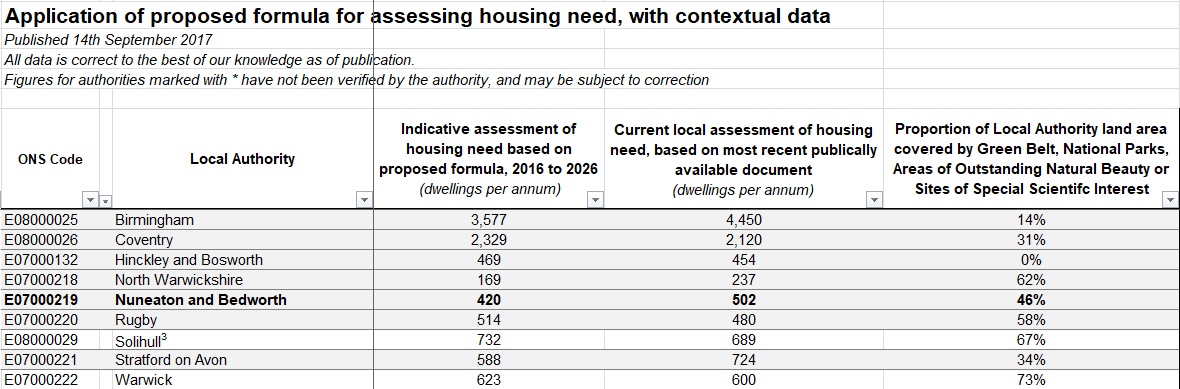
On the 14th September the Government launched a consultation on local housing targets called “Right homes in the right places”.
The Government calculated figure for Nuneaton and Bedworth under these proposals is for 420 homes a year between 2016 and 2026. This is considerably better than the council’s crazy proposals for 702 each year plus making up for not building 702 each year between 2011 & 2017.
They are just proposals out to consultation at the moment and the do generate a crazy figure for Coventry that would need changing. There are serious errors in the estimates and forecasts for Coventry population due to the flow of international migrants and students. These are people getting count in but only partly counted out, often many years after they have left.
We could have a far better plan if we were to restart or rewind the process to base it on 420 homes a year from 2016 to 2031. There would need a debate on taking homes from Coventry but this should be a evidenced based figure for the very end of the plan.
I will be looking at how best to respond to consultation and getting the Borough Council to restart its plan from better baseline.
Nuneaton and Bedworth Borough Council have quietly released their 2017 Air Quality report earlier than normal. Link
This may be the result of the Borough Plan inquiry, the Poplars Farm Planning application and/or pressure over past delays.
Monitoring locations
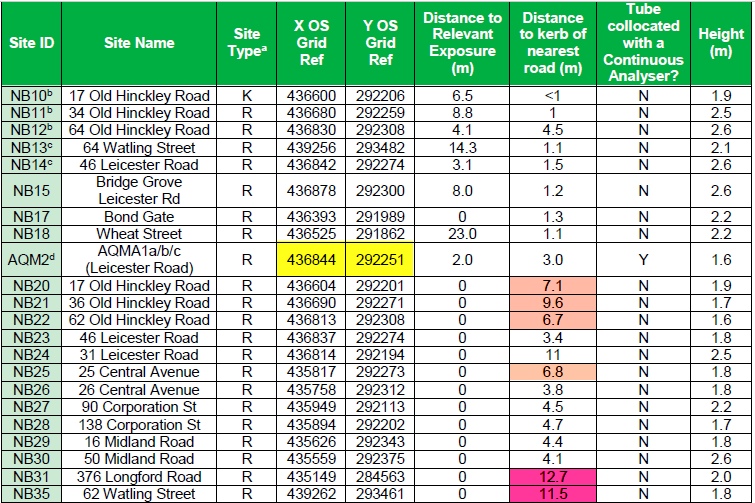
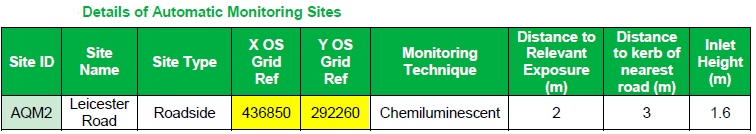
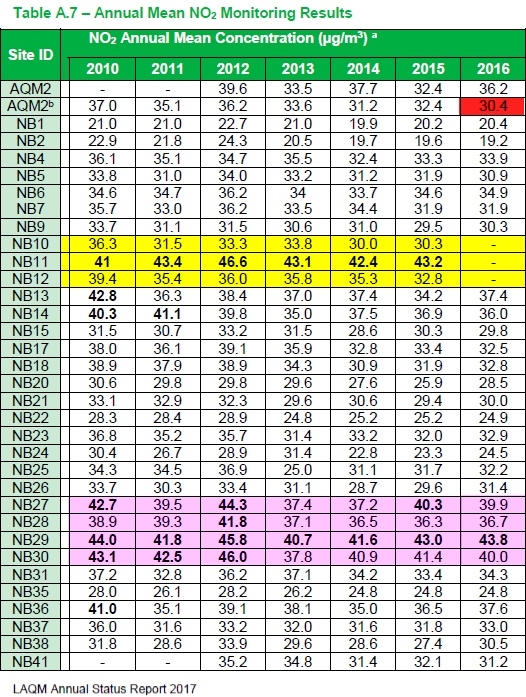
Below is the reported annual average of NO2 measurements from the automatic monitoring station {AQM2}, the 3 diffusion tubes that are co-located AQM2b and roadside/kerbside diffusion tubes NB1-NB41.
Ideally diffusion Tubes should be at head height between 1 and 5 metres from the kerb edge. These are the locations of the key tubes. You will see that many are too far from the road to detect accurately the NO2 from the traffic. Strangely the location for the automatic monitoring station is recorded as being 11 metres (35 feet) from the location of the 3 co-located tubes.
Reported measurements
The automatic monitoring produced a result every 15 minutes while the tubes have to be manually changed every 4 to 5 weeks.
The automatic monitoring station is the most accurate but large and expensive. On top of this are 3 monitoring tubes in order that a local calibration can be made between the two methods. There are then around 30-40 diffusion tubes place around the borough. These give a simple set of measurements each time the tubes are sent to the laboratory. There are however several adjustments to the numbers. Each year all the raw values from the tubes are scaled by a calibration factor. This can either be a locally calculated factor or a national one. They are calculated using the ratio of measurements from the diffusion tubes and automatic monitor(s).
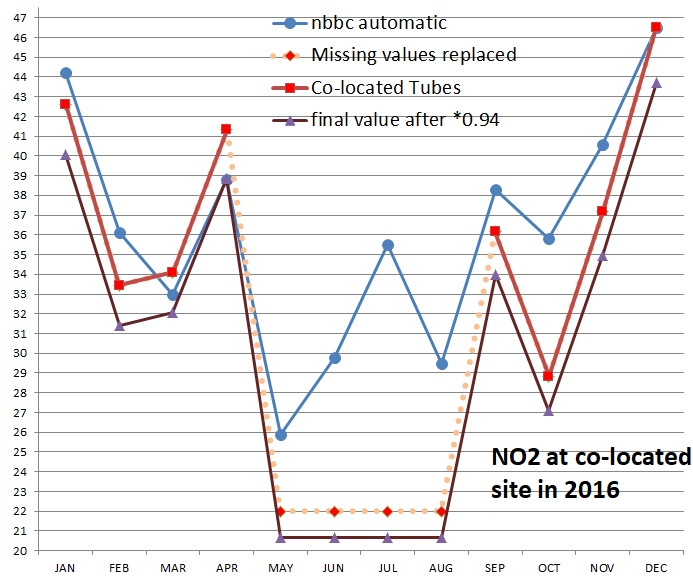
In 2015 the local calibration factor was 0.96 which means the raw diffusion data has been reduced by 4%. In 2016 the council used a national calibration factor of 0.94 which reduces reading by 6%. The council seemed to have only 7 months of comparable data to calculate a local factor. That data pointed to a correction factor of 1.06 which if used would have increased every value by 6%.
Replacing missing data
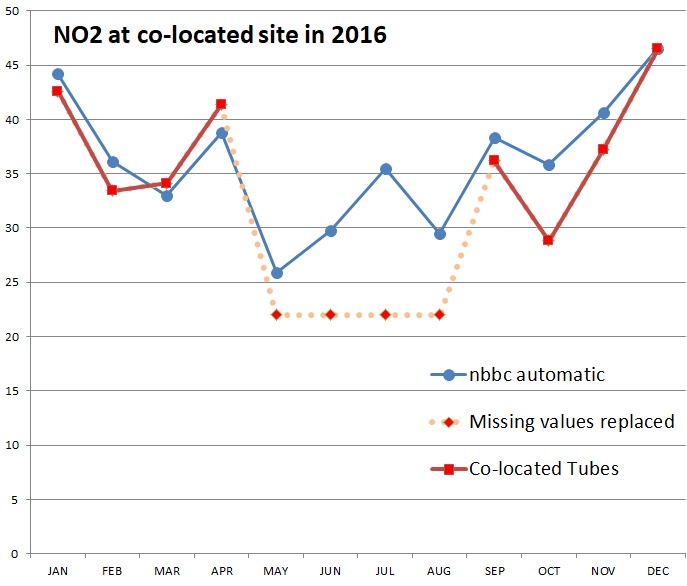
Sometimes diffusion tube data is not available for the whole year. As there is a variation of pollution over each year it is not valid to just add an annual average value. The council have adjusted for the missing values using the ratio of period and annual means for other sites in the Midlands. This seems to have produced a very distorted value for the co-located tubes. Unfortunately the missing value adjustment in effect inserts 4 very low values into the assumed NO2 at the co-located site
making it 16% less
The 8 measurements from diffusion tubes in red average 37.5 but cover only 2/3rd of the year. The calibrated and accurate automatic monitor has an average of 36.2 for the whole year and the average for the same 8 months of 39.2. After in effect replacing the 4 missing values with 22.0 and multiplying by national calibration factor the final “calibrated” value for the tubes over the year is just 30.4. That is how calibration gives a value that is 16% less than reference machine. Remember AQM2 tubes with official annual average of 30.4 and automatic monitoring station with annual mean of 36.4 are in exactly the same location.
Biasing the data
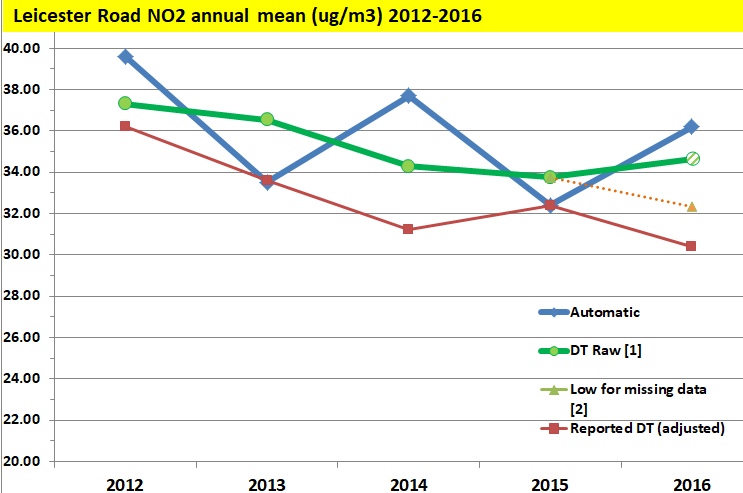
The automatic monitoring station is valuable in providing bias correction information for the measurements from diffusion tubes. Using diffusion tubes to measure NO2 has the risk that the measurements are biased due to numerous factors. In addition, there are significant variations in the measurements from tubes even when co-located. The bias correction factor is supposed to reduce bias in the readings when compared to the very accurate automatic monitor. The chart below shows the average NO2 measurements from the automatic monitor (in Blue) and co-located diffusion tubes (in green DT raw) over the last 5 years. I have shown the Councils reported adjusted level for the NO2 tubes in Red. The 2016 average for the tubes is shown adjusted for the 4 missing months based on local ratio as green line. The Orange dashed line shows the councils more severe reduction due to the correction shown in section above. What is striking is the council have selected a base correction factor which always reduced the level of red line. Remarkably the way the data is bias adjusted makes the data biased!
The average of the automatic monitor (blue line) over 5 years is 35.88ug/m3.
The average of the raw data from diffusion tubes (green line) is 35.30ug/m3.
The average of the bias adjusted data is 32.78ug/m3.
Over 5 years the bias adjustment reduced measurements these co-located tubes and every other tube in the Borough by 7%.
[1] The 2016 average for 8 months was 37.52 and this has been adjusted to 34.65 to take account of missing data being over May-August period.
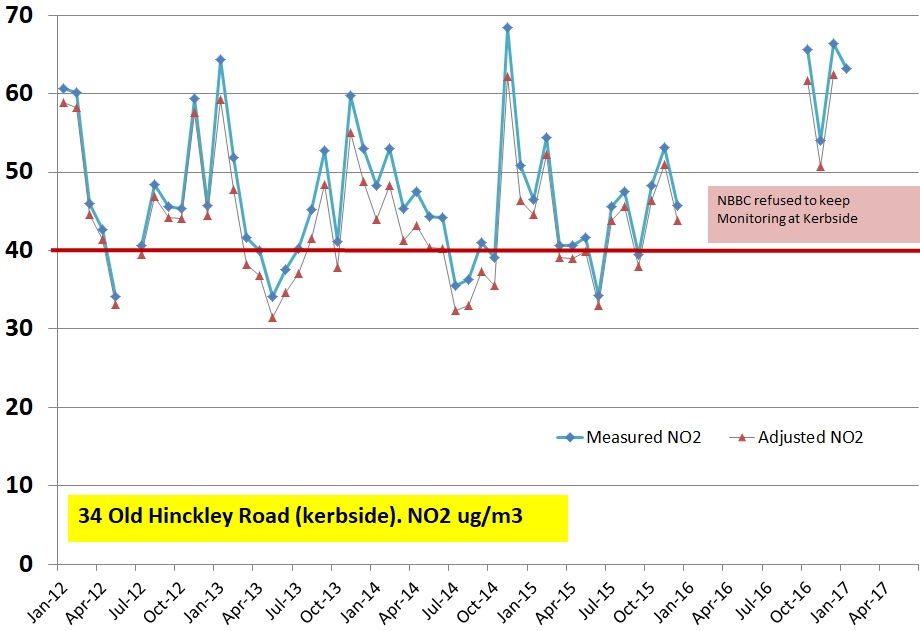
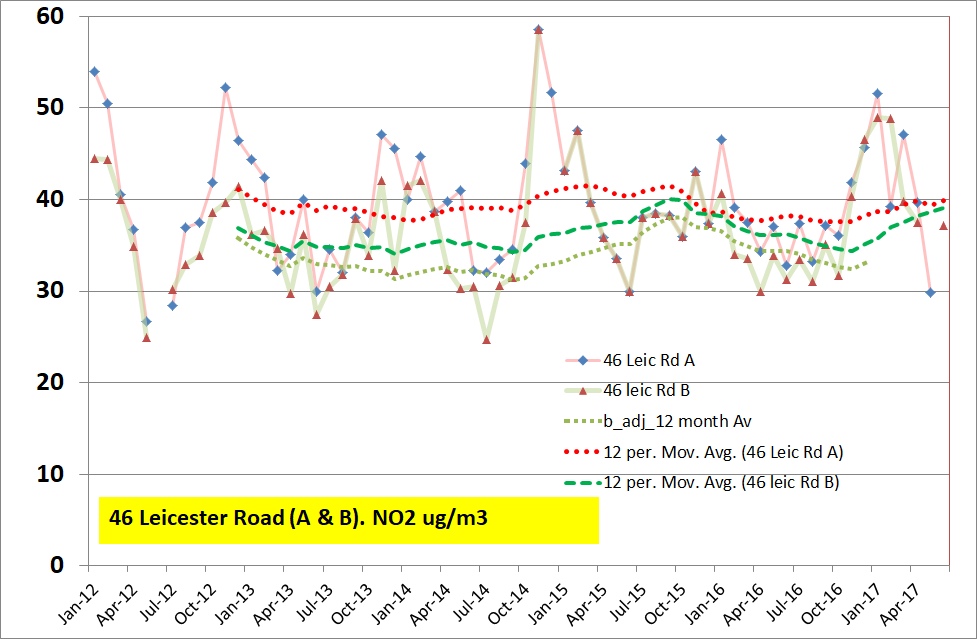
Hinckley Road/ Leicester Road system
It is clear that the improvements before 2011 have not continued at the same rate. The system has had its kerbside monitoring (NB10, 11 &12) removed in 2016 just at the time when traffic impact of new developments is to increase. Many of the remaining monitoring tubes in the area are more than the recommended 5 metres from the kerb.
The highest measurements where obtained on the Lamp Post outside number 34 Old Hinckley Road (called NB13). These are often well above the Legal limits (40ug/m3 average over the year) but the council talks about legal limits at receptors. It considers these to be people inside homes and places a few monitoring tubes on the walls of homes. Those which are set back get considerably less NO2 that on the pavements. At the start of 2016 the council stopped measuring the NO2 at NB13 but seems to have taken 4 frightening measurements again in October, November, December 2016 and January 2017. The chart shows the raw measurements and scaled down bias added values.
Round on the sharp corner from Old Hinckley Road to Leicester Road are diffusion tubes NB14 (close to road) and NB23 (on wall between 2 bay windows). Pollution at both measurement locations show no clear sign of improvement since 2012. Both sets of tubes have been reading around 50ug/M3 this winter.
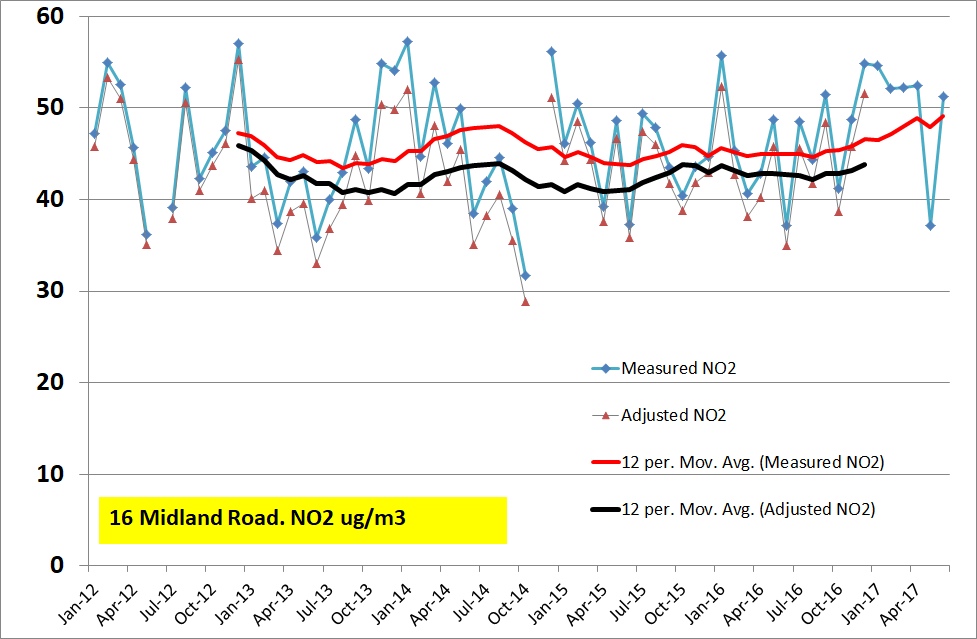
Midland Road/ Corporation Street
The air quality at the front wall of some homes in this area are well above the legal limit even after the council applies maximum bias adjustments. Levels on the pavements & carriageway will be even higher for those passing though. This is currently getting worse and the council is pretending the problem will just go away with cleaner cars and the Borough Plan.
What needs to be done
The Council is currently doing far too little to reduce air pollution, it is pretending it is going away. The council is not breaking the Law but doing as much as it legally can to do nothing. It lets more pollution producing development happen with little or no sustainable transport improvements.
We need to revise the cuts to air quality monitoring and separate its management from those who are responsible for promoting more development. We need a funded action plan not just a wish-list of things that never happen.
Raising issues at Council meeting
Notes:-
1) DEFRA guidance on using diffusion tubes link
2) Annual air quality reports are on NBBC website
a)Nuneaton and Bedworth Air Quality Annual Status Report 2017 PDF, 1.71 MB
b)Nuneaton and Bedworth Air Quality Annual Status Report 2016 PDF, 2.19 MB
c)Nuneaton and Bedworth Air Quality Updating and Screening Assessment 2015 PDF, 2.25 MB
d)Nuneaton and Bedworth Air Quality Progress Report 2014 PDF, 4.8 MB
e) Nuneaton and Bedworth Air Quality Progress Report 2013 PDF, 1.32 MB
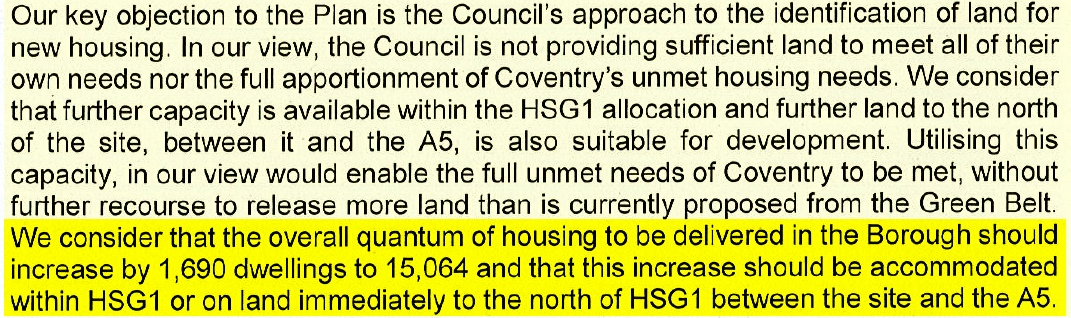
The public inquiry into the Nuneaton and Bedworth Borough Plan starts with 3 days of hearings on 30th August 2017. I have obtained a copy of the county council response to the Borough Plan produced for it by Amec Foster Wheeler in order to promote housing on WCC owned Top Farm. It also includes may general comments on the plan.
What is most shocking in the response is the county council trying to push the housing target up to 15,064 homes. We already have no way to get the infrastructure needed for the existing target.
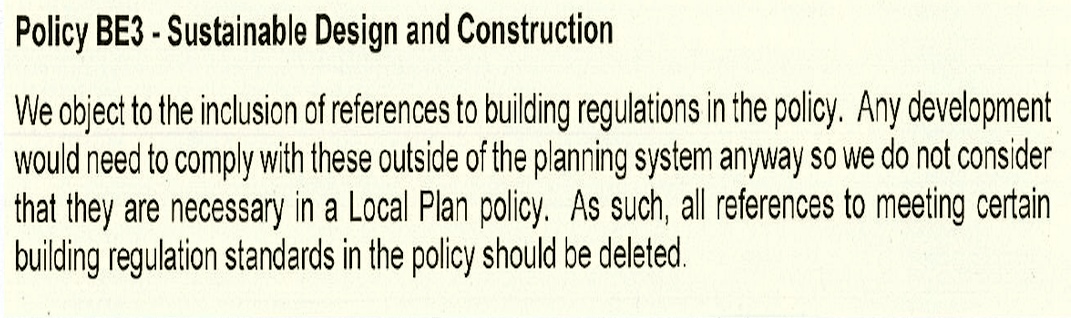
There is lots to worry about in the response from County council, including their desire to oppose reasonable requirements over sustainable design and consultation. Other parts of Warwickshire will have more sustainable homes than in Nuneaton & Bedworth. How can that be fair.
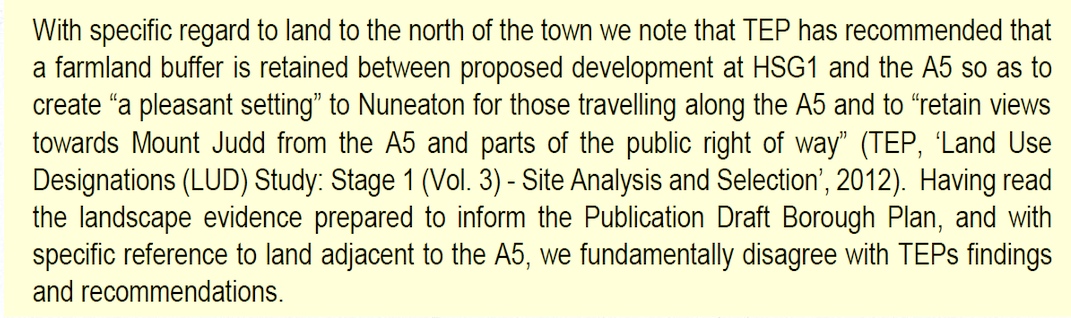
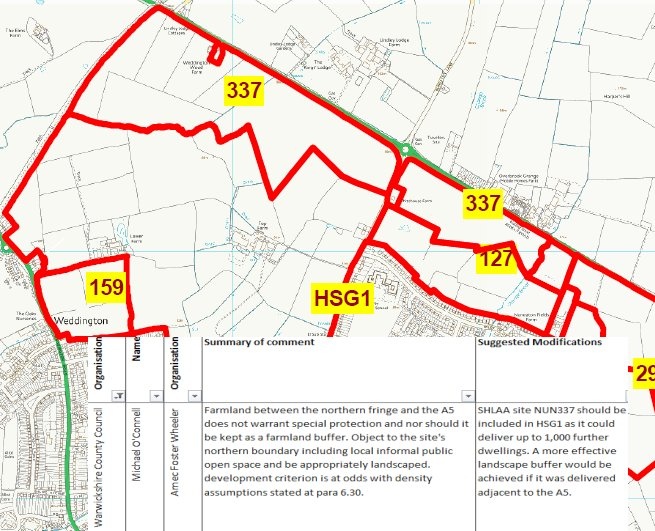
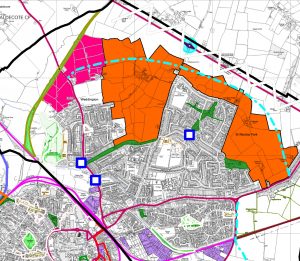
And Warwickshire County council want Nuneaton to be built right up to A5. They do not think we should even keep a strip of countryside or views of Mount Judd
The Labour controlled Nuneaton and Bedworth Borough Council decided to hold back to back cabinet and Full council meetings to approve sending the crazy borough plan to the planning inspector.
video of cabinet meeting
video of full council
There are also council videos but these have gaps in the audio.
I have taken onboard as much as possible from my meetings and independent consultation. In my alternative option I want to reduce the current housing target to around 5,000. From existing plans the council has potential sites for around 3,300 homes. Land East of the new railway station at Bermuda seems the most sustainable location for allocation that cannot fit in the existing urban areas. I have also proposed the planners look at some housing east of Judkins and opposite the Acorn Pub.
Key to making it sustainable is good cheap bus services, cycle routes and 3 new railway staions.
I think it should be for people in Bedworth and Bulkington to finds some land for around 1/3rd of the allocation (that is around 700 homes).
I am running my own Borough plan consultation events after being banned from informing residents about alternative options at official events.
The first event is at Weddington Church hall, on Church lane Weddington on Wednesday 14th August between 6 PM and 8 PM. This event will be more of a drop in session. The second is at Ambleside sports club on Monday 19th August between 7 PM and 9 PM. This event will start with a short talk followed by “drop in event”.
Nuneaton and Bedworth Borough Council are currently running a consultation into their “preferred options” for our Borough Plan. I do not believe the process has been fair, honest or democratic. The official consultation is very difficult and fails to give the public an easy way to comment on the scale and location of development.
Please take part in this independent consultation, which will be submitted, to the council as part of the process.
 Building over 15,000 extra homes for 6,455 households is crazy. Expecting 20,000 extra people to move to Nuneaton and Bedworth is not going to happen.