The Officer for National Statistics (ONS) release population for each council area in England and Wales each year and a projection of possible future population every second year. Once a decade they do a census of the whole population to get a more accurate snapshot and the next census is due in 2021. These population estimates are used and often misused to justify future developments and local plan targets.
The current set of local plans for the 5 districts in Warwickshire and Coventry City run from 2011 to 2031 and are initially based on 2012 estimated population and 2012 based projections. There has always been considerable scepticism on the reliability of the estimates and forecasts especially for the city of Coventry which is claimed to have implausibly large population growth.
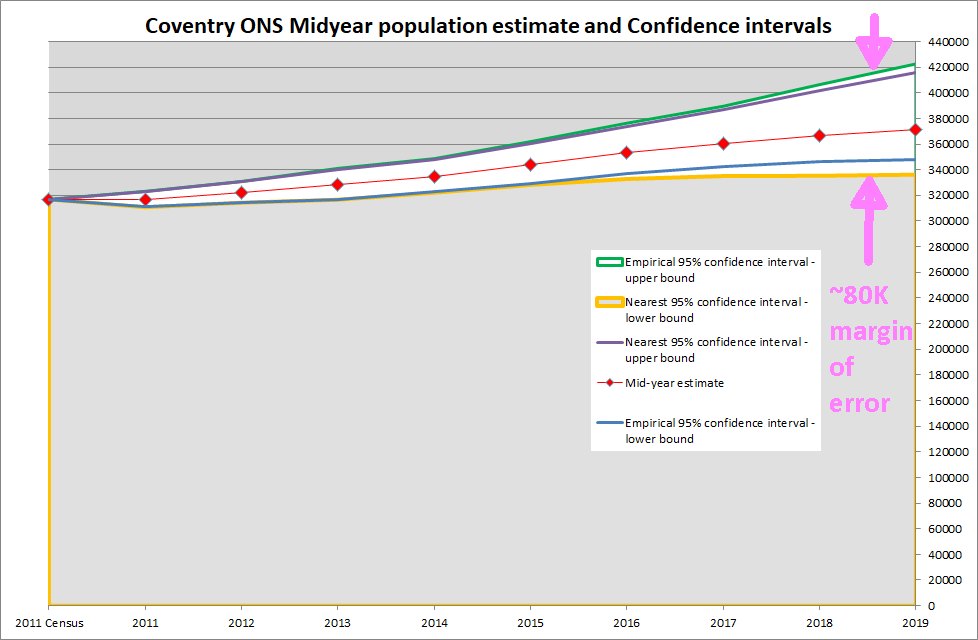
Many campaigners have argued the figures are wrong at local plan hearings and when responding to planning applications. On the 9th December the ONS released the latest confidence intervals for their population estimates and they show that in reality the ONS does not have a clue about the population of Coventry. The 95% Empirical confidence range for the 2019 population of Coventry is between 347,566 and 422,572 people. That is a range of 75,006 people. The ONS also do a 95% confidence interval for possible values nearest their actual 2019 midyear estimate of 371,521. That range is from 336,216 to 415,876 or a total range of 79,659 people. This is just plain crazy, they have in effect no idea.
https://www.ons.gov.uk/releases/uncertaintyofmidyearpopulationestimates2017to2019
Taking a look at the Coventry estimates realty shows anything from slow population growth that stalls or rapid growth that accelerates is possible from ONS model.
Even more crazy is the estimated mid-year population for Stratford-on-Avon. The published estimated population is above the 95% normal confidence interval and even all of the 1000 model runs if I have read the method correctly.
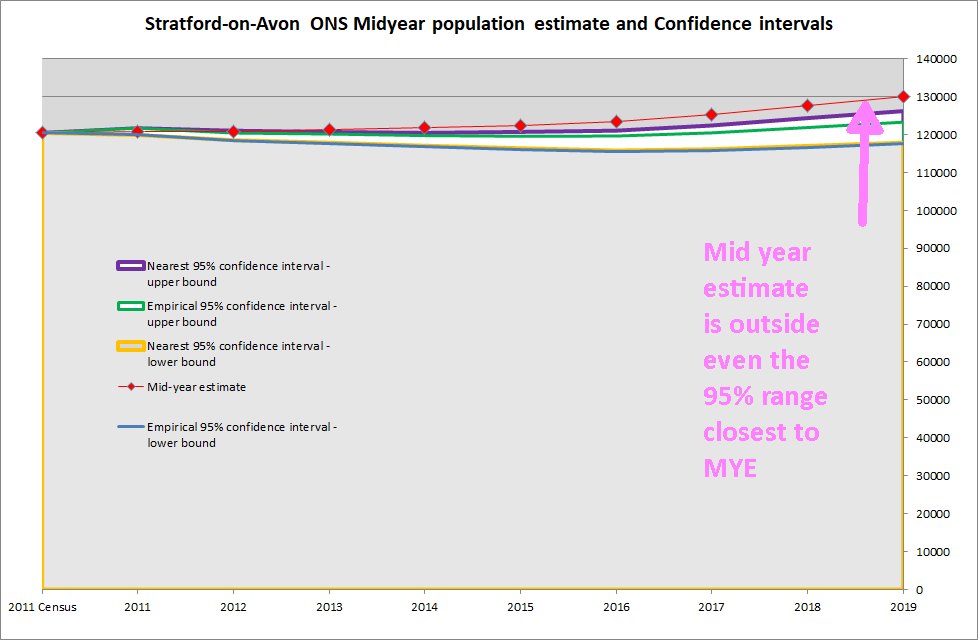
I have zoomed it to the 5 lines. The red line is the published population estimate. The normal 95% confidence interval is between the solid blue and green lines. The dashed purple and yellow lines show the 95% of the modelled values nearest estimate. This shows the published mid year estimate is above any of the 1000 model runs.
