On top of the scandal over the wording of the Air Quality Assessment are serious questions about the quality of the modelling. The model should start with an accurate representation the current traffic and air quality. Then project how the air quality will change over the years to 2031 with and without development and show the impact of mitigation.
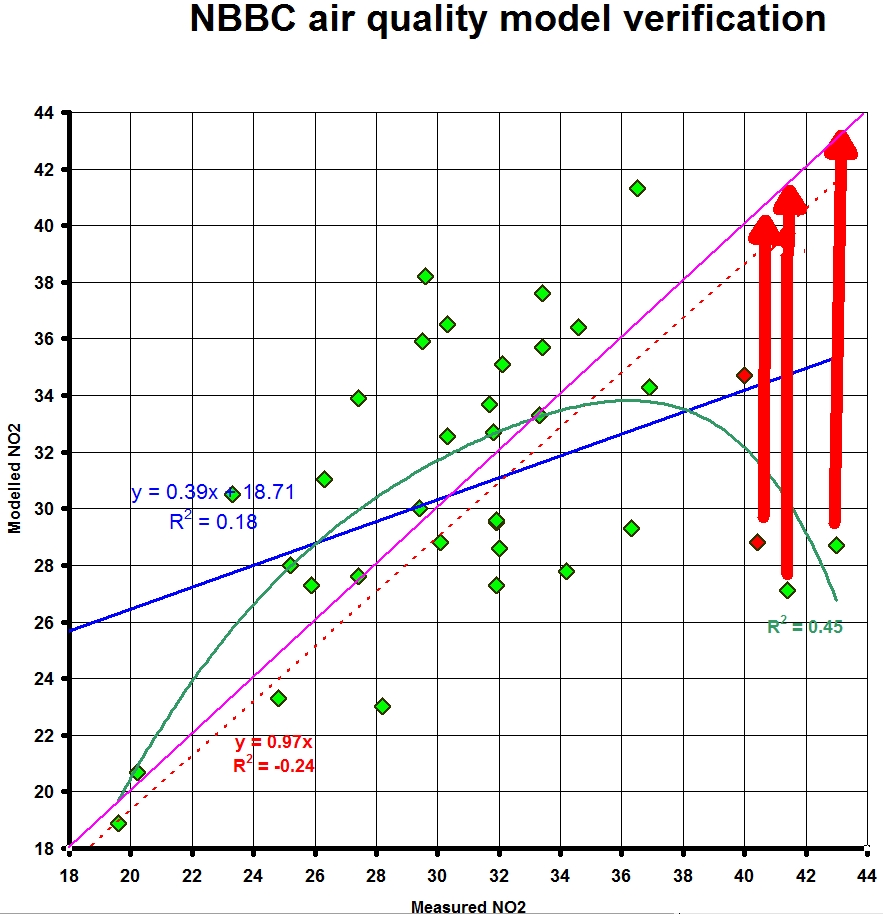
Sadly almost everything is wrong. The model cannot even get 2015 correct in areas with poor air quality. The worst the air quality the better it is in the model. If the modelling was good then all the verification points would be close to the pink 1to1 line. You should see that points of high measured NO2 are massively under modelled.
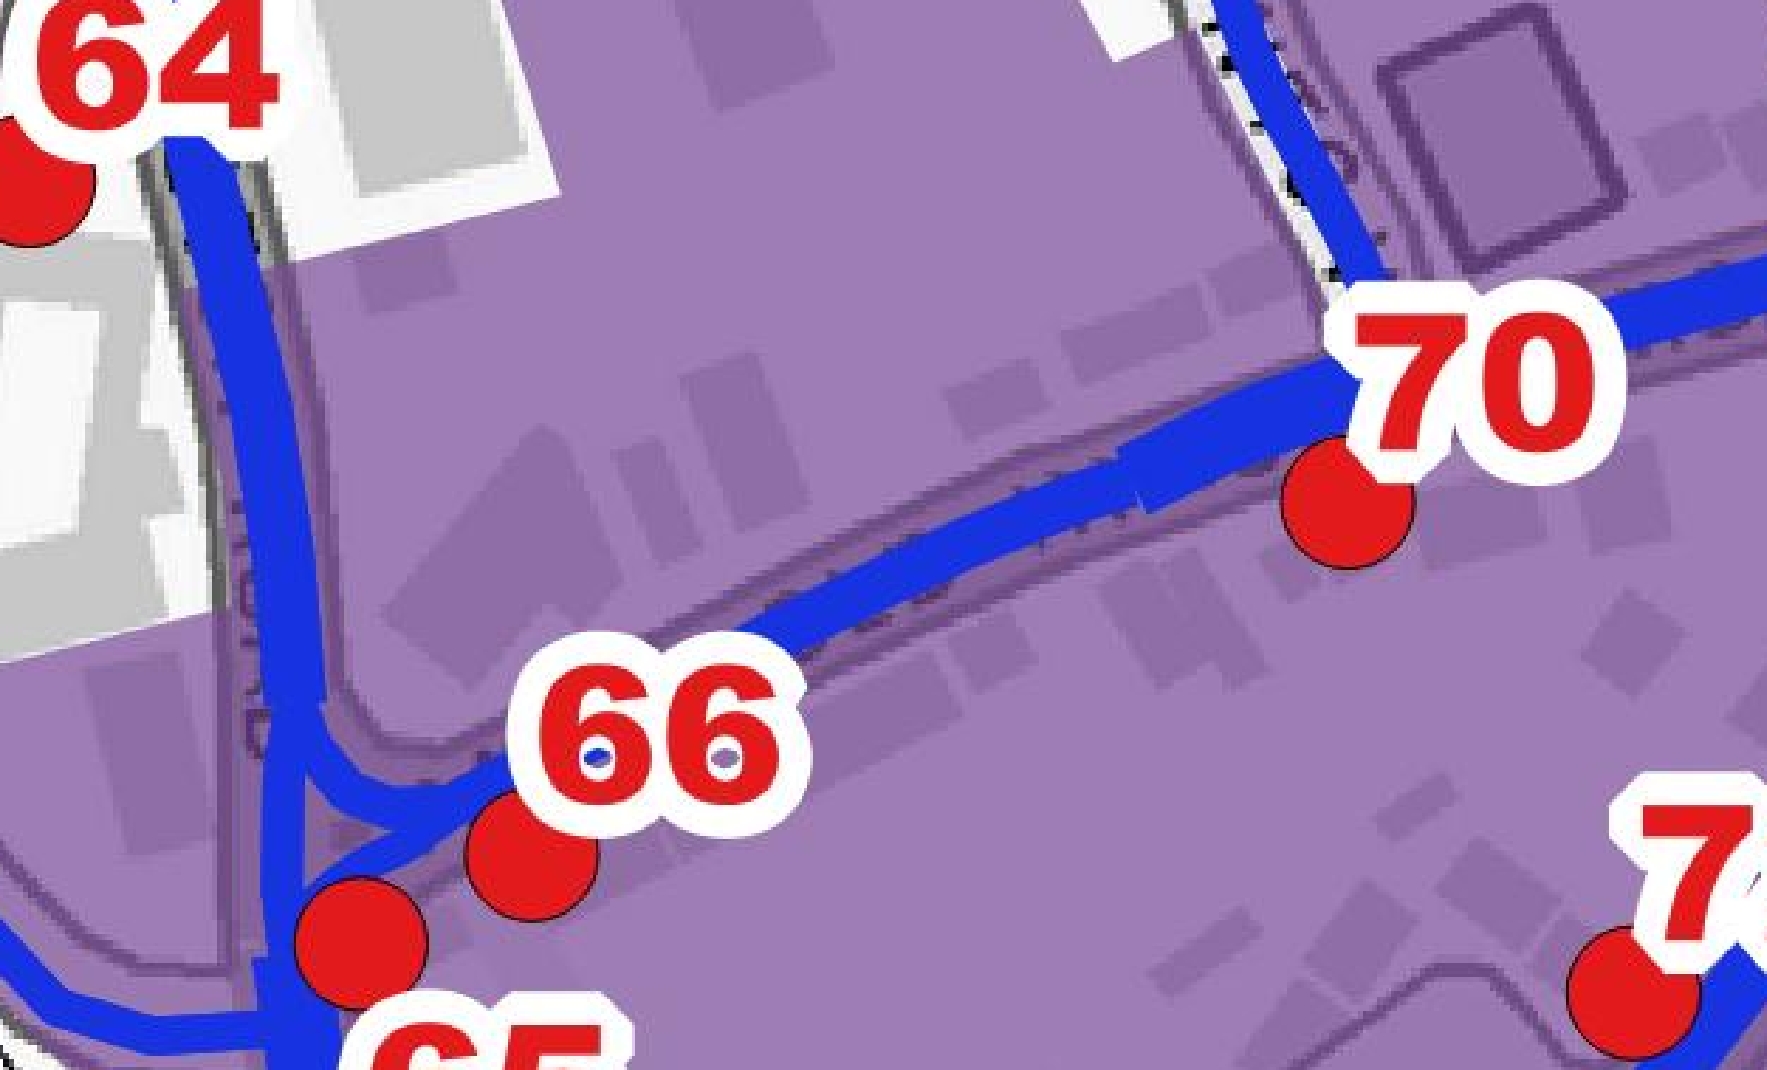
I am trying to find out what went wrong. One issue is the roads seem to be modelled at the wrong width in some places. Parts of Old Hinckley road are show as single lane.
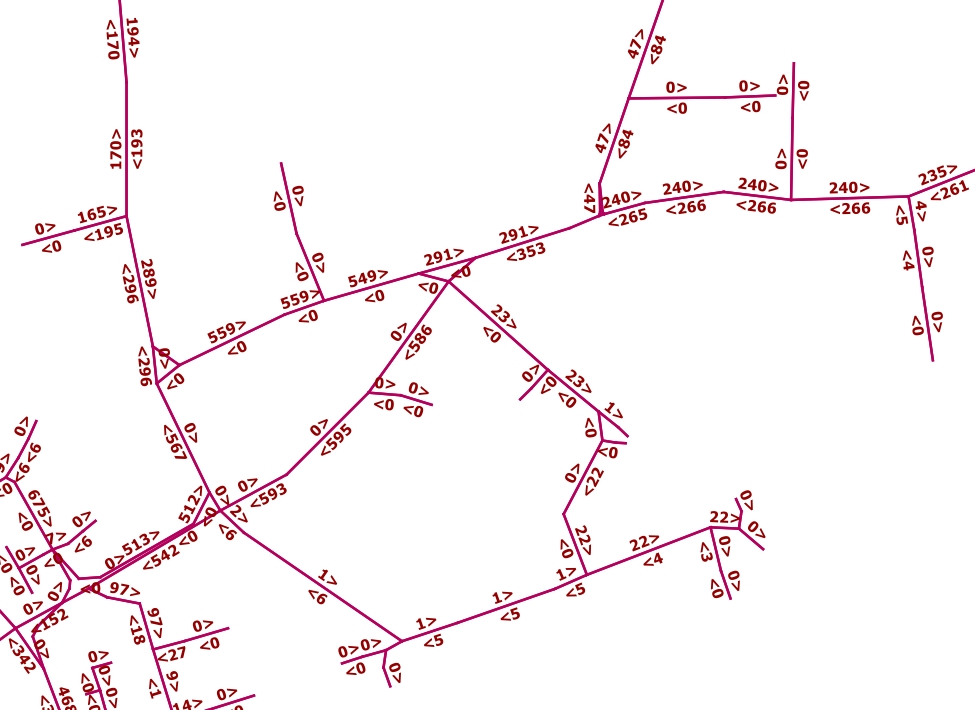
The second big issue is the modelled traffic flows and speeds around places like Old Hinckley Road. There seems to be missing HGVs and excessive speeds on corners. Only 6 HGV & buses out of Trent road each day.